Introducing iTAAP®
Empowering Education with Predictive Analytics
iTAAP® by Expatiate Communications harnesses AI for real-time projections and empowers LEAs with actionable insights.
What is iTAAP®?
iTAAP® (Improving Academic Achievement Through Predictive Analytics) is a predictive analytics solution that empowers educational institutions to forecast future performance using real-time data.
Interested? Request a demo now.
Request iTAAP® Demo
The Problem
The California Dashboard only updates once a year. By the time data is available, it’s already outdated—too late to help students who need support now.
On top of that, it lacks true insight. You’re shown what has happened, but never what could.
Without predictive data, educators are forced to react instead of plan ahead.
Stale Data
CA Dashboard's primary flaw is its outdated approach. While the education landscape is in constant flux, Test Dashboard updates only once a year. This means you're working with data that is, at best, outdated and, at worst, no longer relevant. Stale data can't fuel informed decisions or drive meaningful change in your school district.
No Insights
What's the point of data if it doesn't help you take action? CA Dashboard only provides data that you already know. It doesn't offer any meaningful, actionable insights. It's like having a map that only shows you where you've already been, rather than guiding you to where you should go. It's a missed opportunity for improving your school district's performance.
The Solution
Here’s how iTAAP® helps transform your data into meaningful outcomes:

Connect Data
Say goodbye to data headaches! With iTAAP, you only need to connect your school district's data once. Our system automatically integrates all your data sources, saving you time and effort.

Real Time Updates
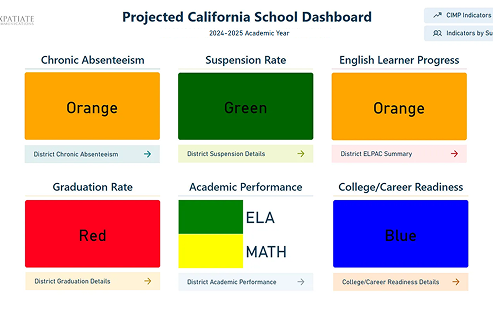
iTAAP® harnesses the power of AI to provide real-time projections for state indicators like Chronic Absenteeism, CIMP, LRE, and Disproportionality.

School Specific Insights
Dive deep into each school’s performance data. Identify strengths, gaps, and craft targeted improvement plans.

Student Level Insights
Identify individual students needing support and understand the patterns behind their challenges.

Improve Performance
Turn your data into action. See what works, improve outcomes, and ensure success across your district.
With iTAAP®, you can

Prepare for Success
Easily find which students won't meet time and frequency compliance well in advance.

Anticipate the Future
Receive advance warnings on disproportionality and significant disproportionality.

Meet Deadlines
Automatically alerts IEPs which lack procedural or substantive compliance.
iTAAP® for Administrators
From streamlining compliance to improving student outcomes, iTAAP® helps you lead with confidence and clarity.
Attend Less IEP Meetings
Leverage trends to reduce the need for frequent IEP meetings with proactive planning.
Reduce Litigations
Address compliance gaps before they escalate into disputes or challenges.
Improve Student Outcomes
Personalize support using real-time student data to drive better progress.
Easy Access to Data
Quickly surface student-level or district-wide insights with a streamlined dashboard.
Automate Reports
Auto-generate accurate reports for IEPs, CDE submissions, or audits—on demand.
Save Time
Automated workflows free your team to focus on student success instead of spreadsheets.
How iTAAP® Keeps LEAs in Full IEP Compliance
Technical resources for Special Education Directors and SELPA Administrators on staying ahead of IDEA requirements with AI-powered predictive analytics.
Special Education Compliance Brief
A technical brief for Special Education Directors & SELPA Administrators on using AI-powered predictive analytics to meet IDEA and state requirements — before violations occur, not after.
From Reactive to Proactive
A comprehensive guide covering IEP compliance tracking, disproportionality monitoring, SPPI indicators, and how iTAAP® transforms real-time data into proactive action for your LEA.
Arrange a Demo
Want to see the powerful features of iTAAP® in action? Contact us and we’ll follow up within 24 hours.